Epoch:
Update:
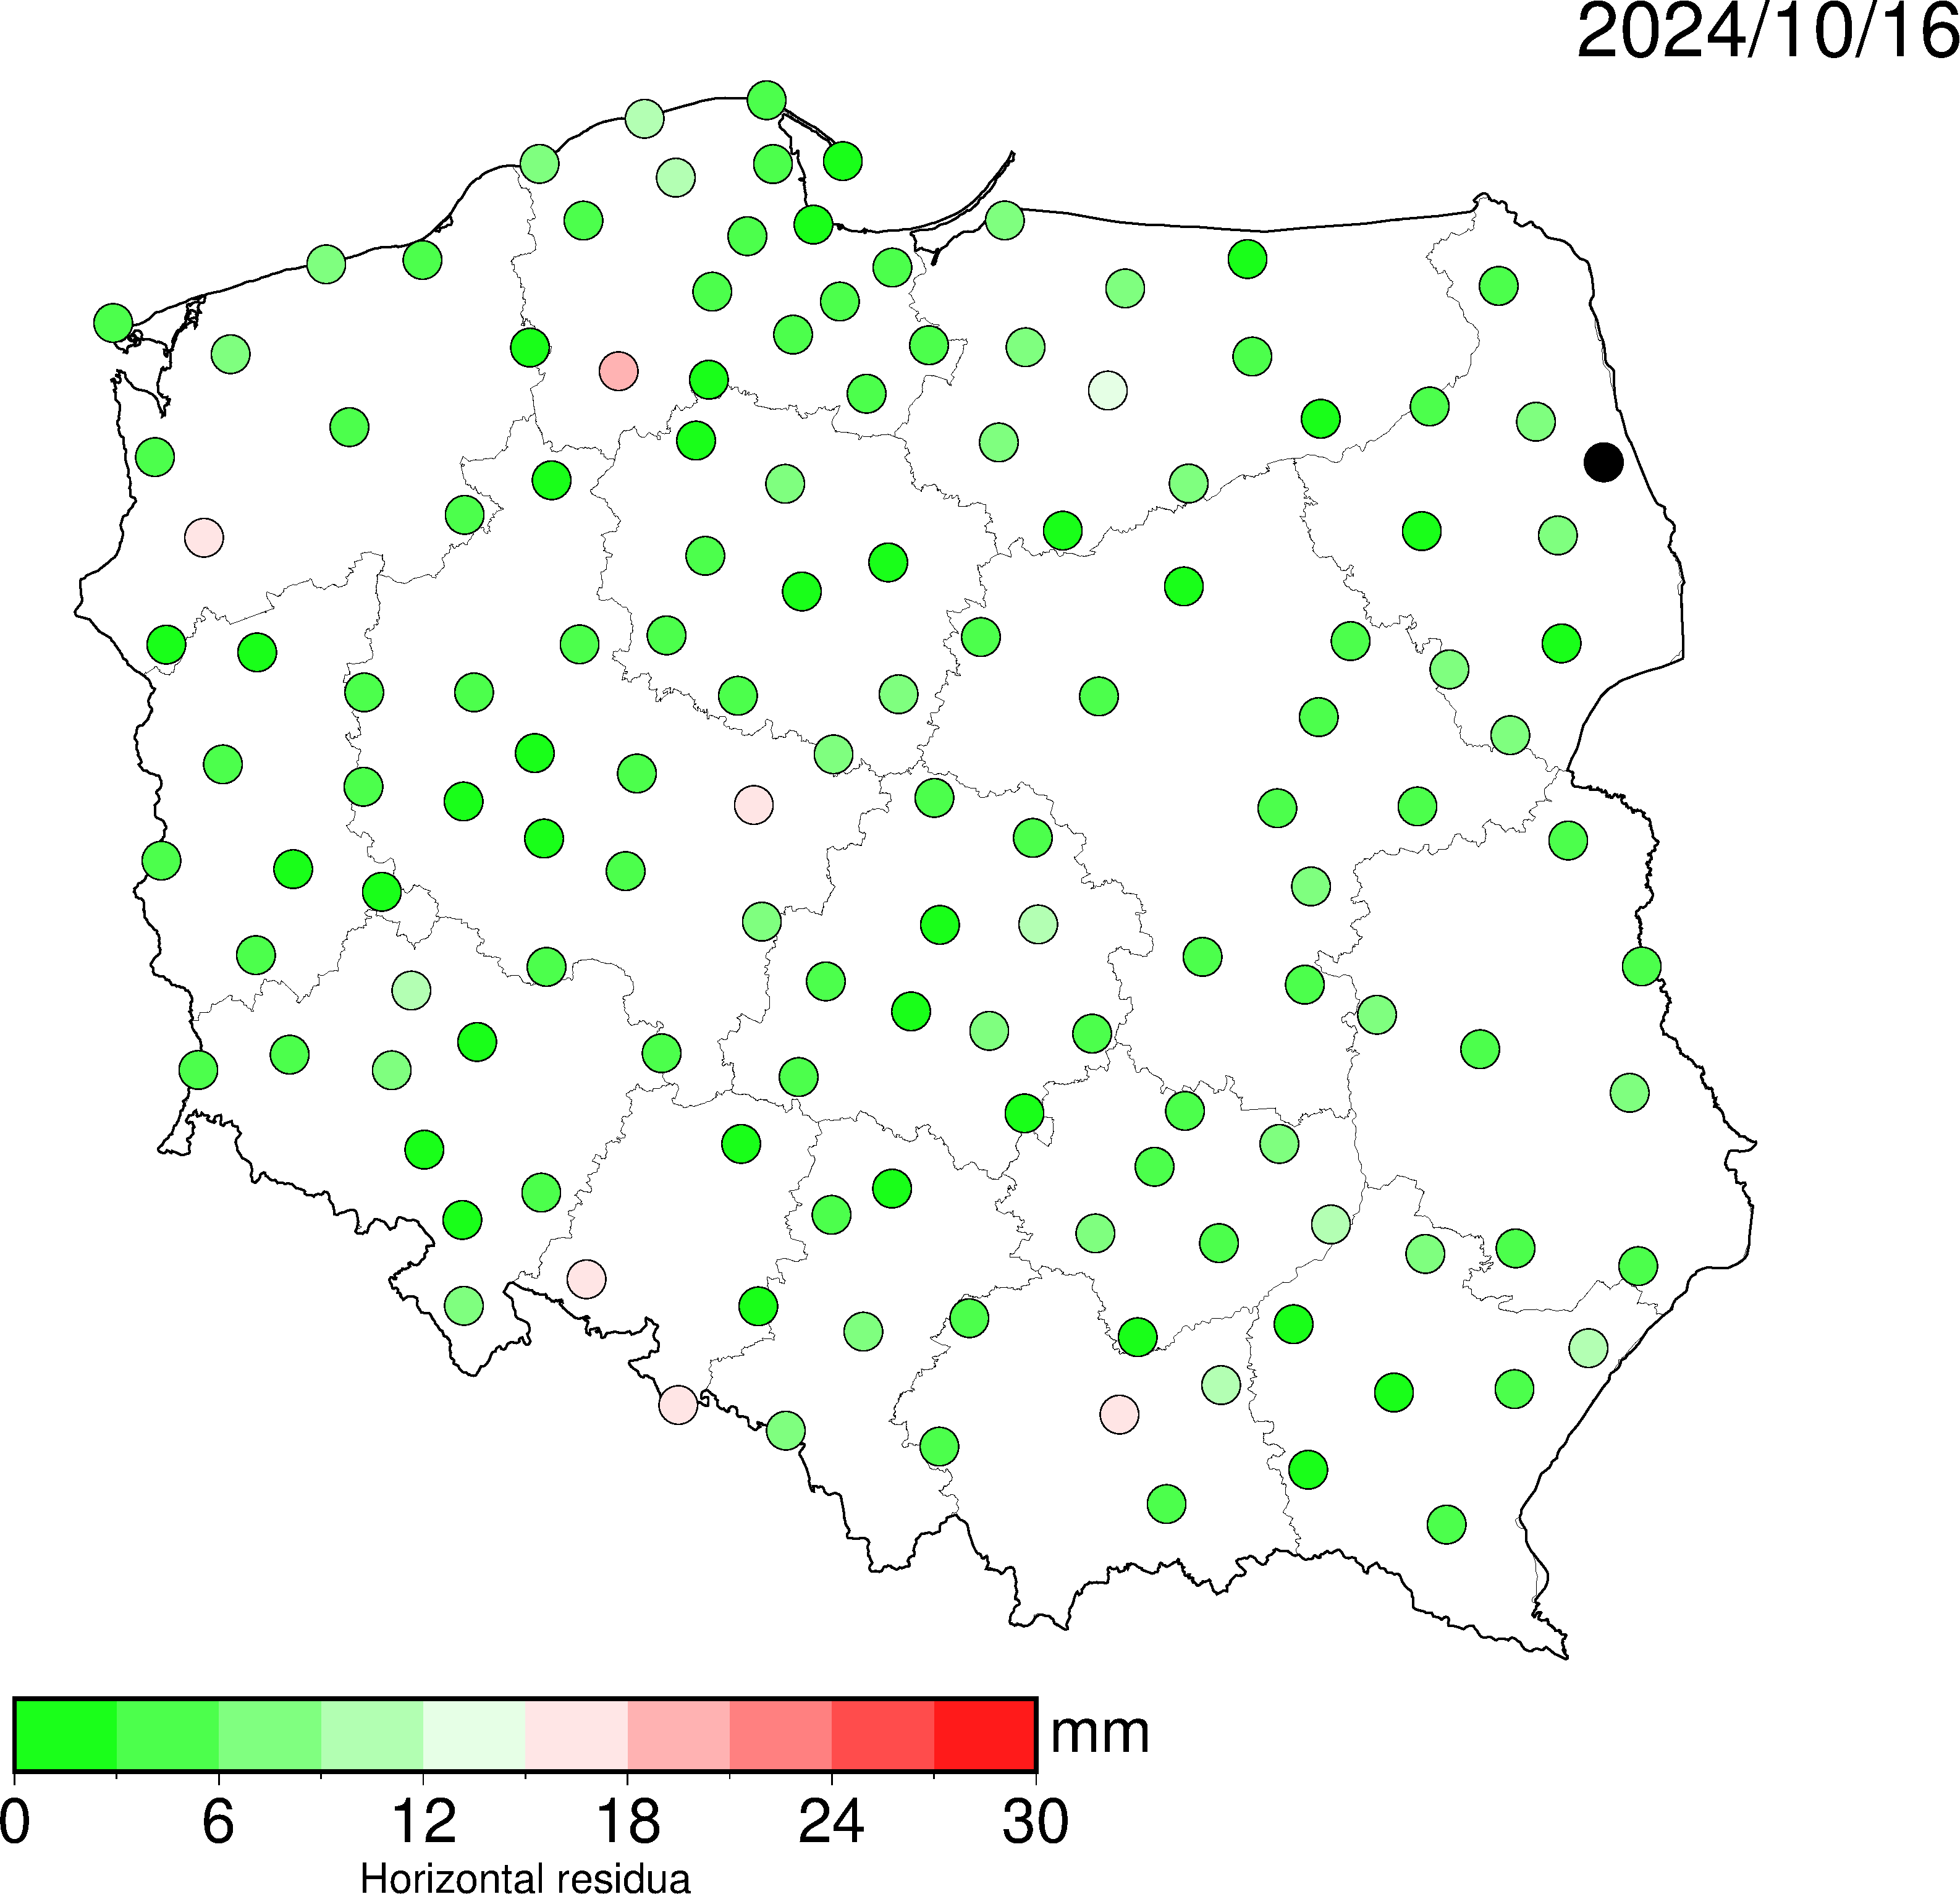
Position residua:
1 - 10 mm
11 - 20 mm
21 - 30 mm
> 30 mm
no solution
no solution over 30 days
| Network: | ||
|---|---|---|
| ID: | ||
| DOMES: | ||
| Receiver: | ||
| Antenna: | ||
| First data: | ||
| Last data: | ||
| GNSS: | ||
| Last coordinate estimate (ITRF2014): | ||
|---|---|---|
| Last coordinate estimate (ETRF2000): | ||
| The difference from the position in RT services: | ||
| Position variations in the last 30 days: | ||
| Software used | GAMIT v. 10.71 |
| Observations | Nonredundant double differences, linear combination, pseudo-range used only to determine clock corrections and solve MW-WL ambiguity; cutoff mask: 3 degrees; data sampling rate: 30 seconds for data cleaning, 2 minutes in LSA analysis; receiver noise: codes C1 and P2' corrected to P1 and P2 based on monthly values developed by CODE. |
| Orbits | CODE RAPID lub IGS RAPID (zależnie od dostępności). |
| Satellite antenns | IG14.atx. |
| Satellite clocks | Estimated during data processing and cleaning, initial values are taken from on-board ephemeris generated by SOPAC, final clocks determined based on orbits and station coordinates. |
| Receiver antenass | IGS type mean (IGS14.atx) and individual calibration at selected EPN (EPNC.atx) and ASG-EUPOS (ASGC.atx) stations. |
| Receiver clocks | Estimated from pseudoranges. |
| Tropospherr | ZTD values estimated in 1h interval, gradients (N-S and E-W) determined once a day. Tropospheric delay and mapping functions from VMF1 or GPT2 model (depending on availability). |
| Ionosphere | 1st order effects eliminated by using linear combination, 2nd and 3rd order effects modeled from global electron density maps (VTEC) and IGRF2012 geomagnetic field model. |
| Tidal displacements | Solid Earth tides: IERS 2003; zero frequency effect included in tidal model (not in station displacements); pole tide: IERS 2010, mean pole removed by linear trend; ocean tidal effect: IERS 2010, displacements based on amplitude and phase of 11 major tidal waves interpolated for each station from FES2004 model. |
| Earth orientation parameters | IERS Bulletin A (based on USNO), diurnal and semi-diurnal variations in pole motion (X,Y) and UT1 time due to ocean tides included according to IERS 2010; precession according to IAU1976 model, nutation - IAU2000. |
| Reference frame | ITRF2014 defined by 41 EPN stations with transformation to ETRF2000. |
GNSS signal strength statistics
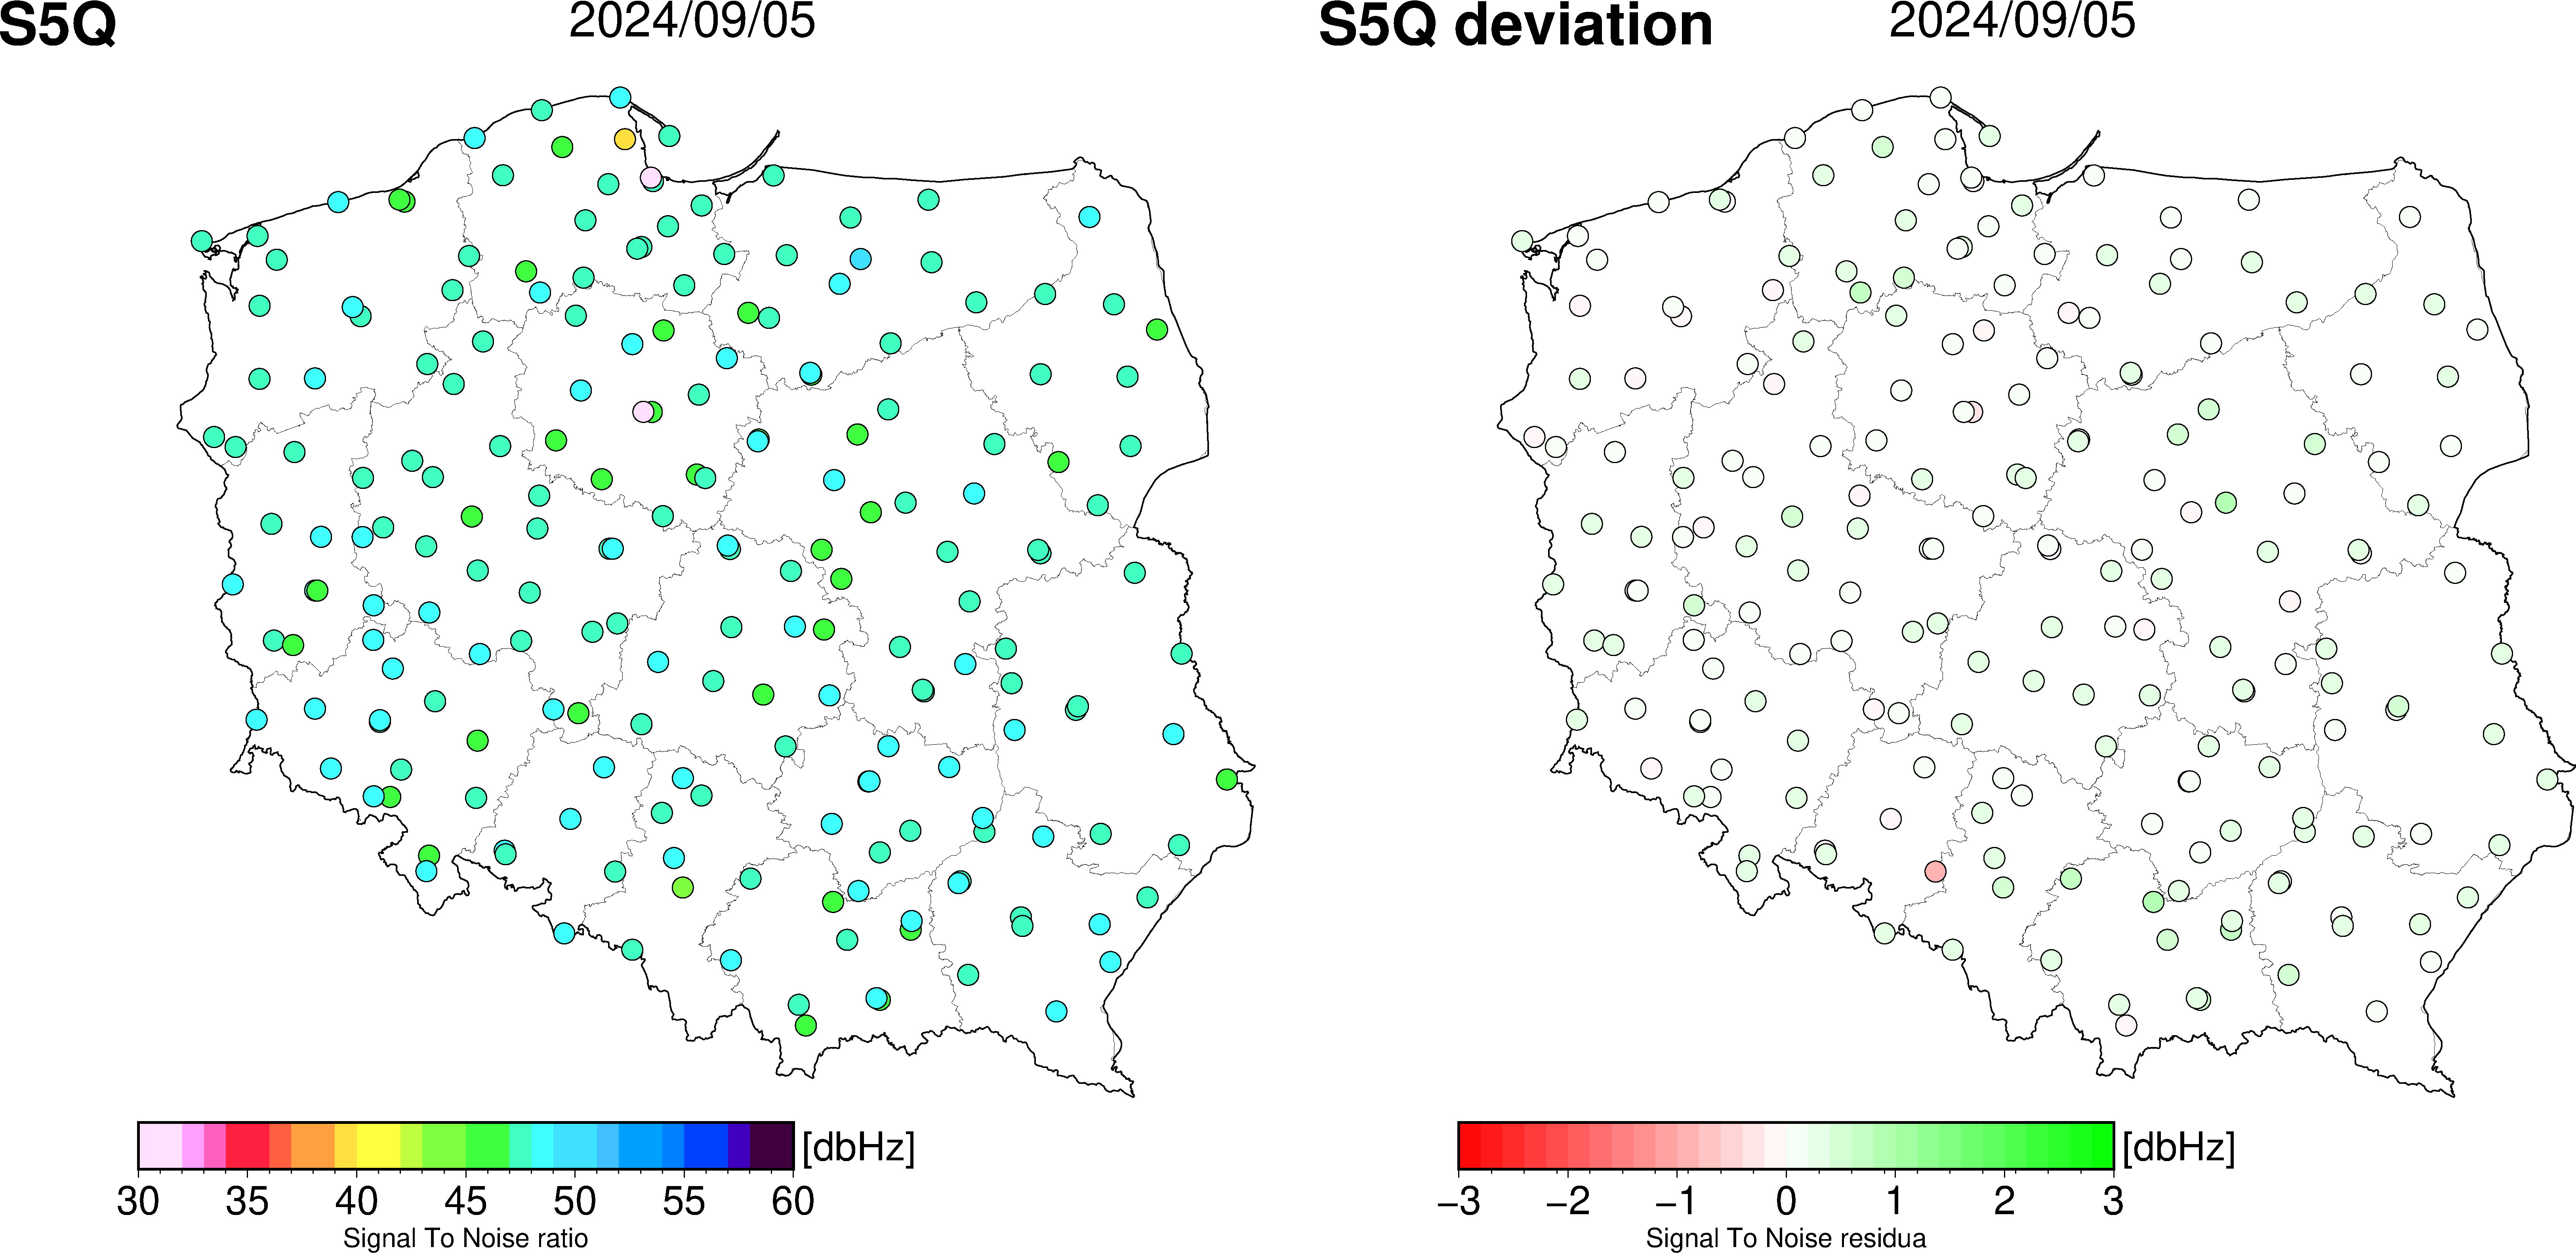
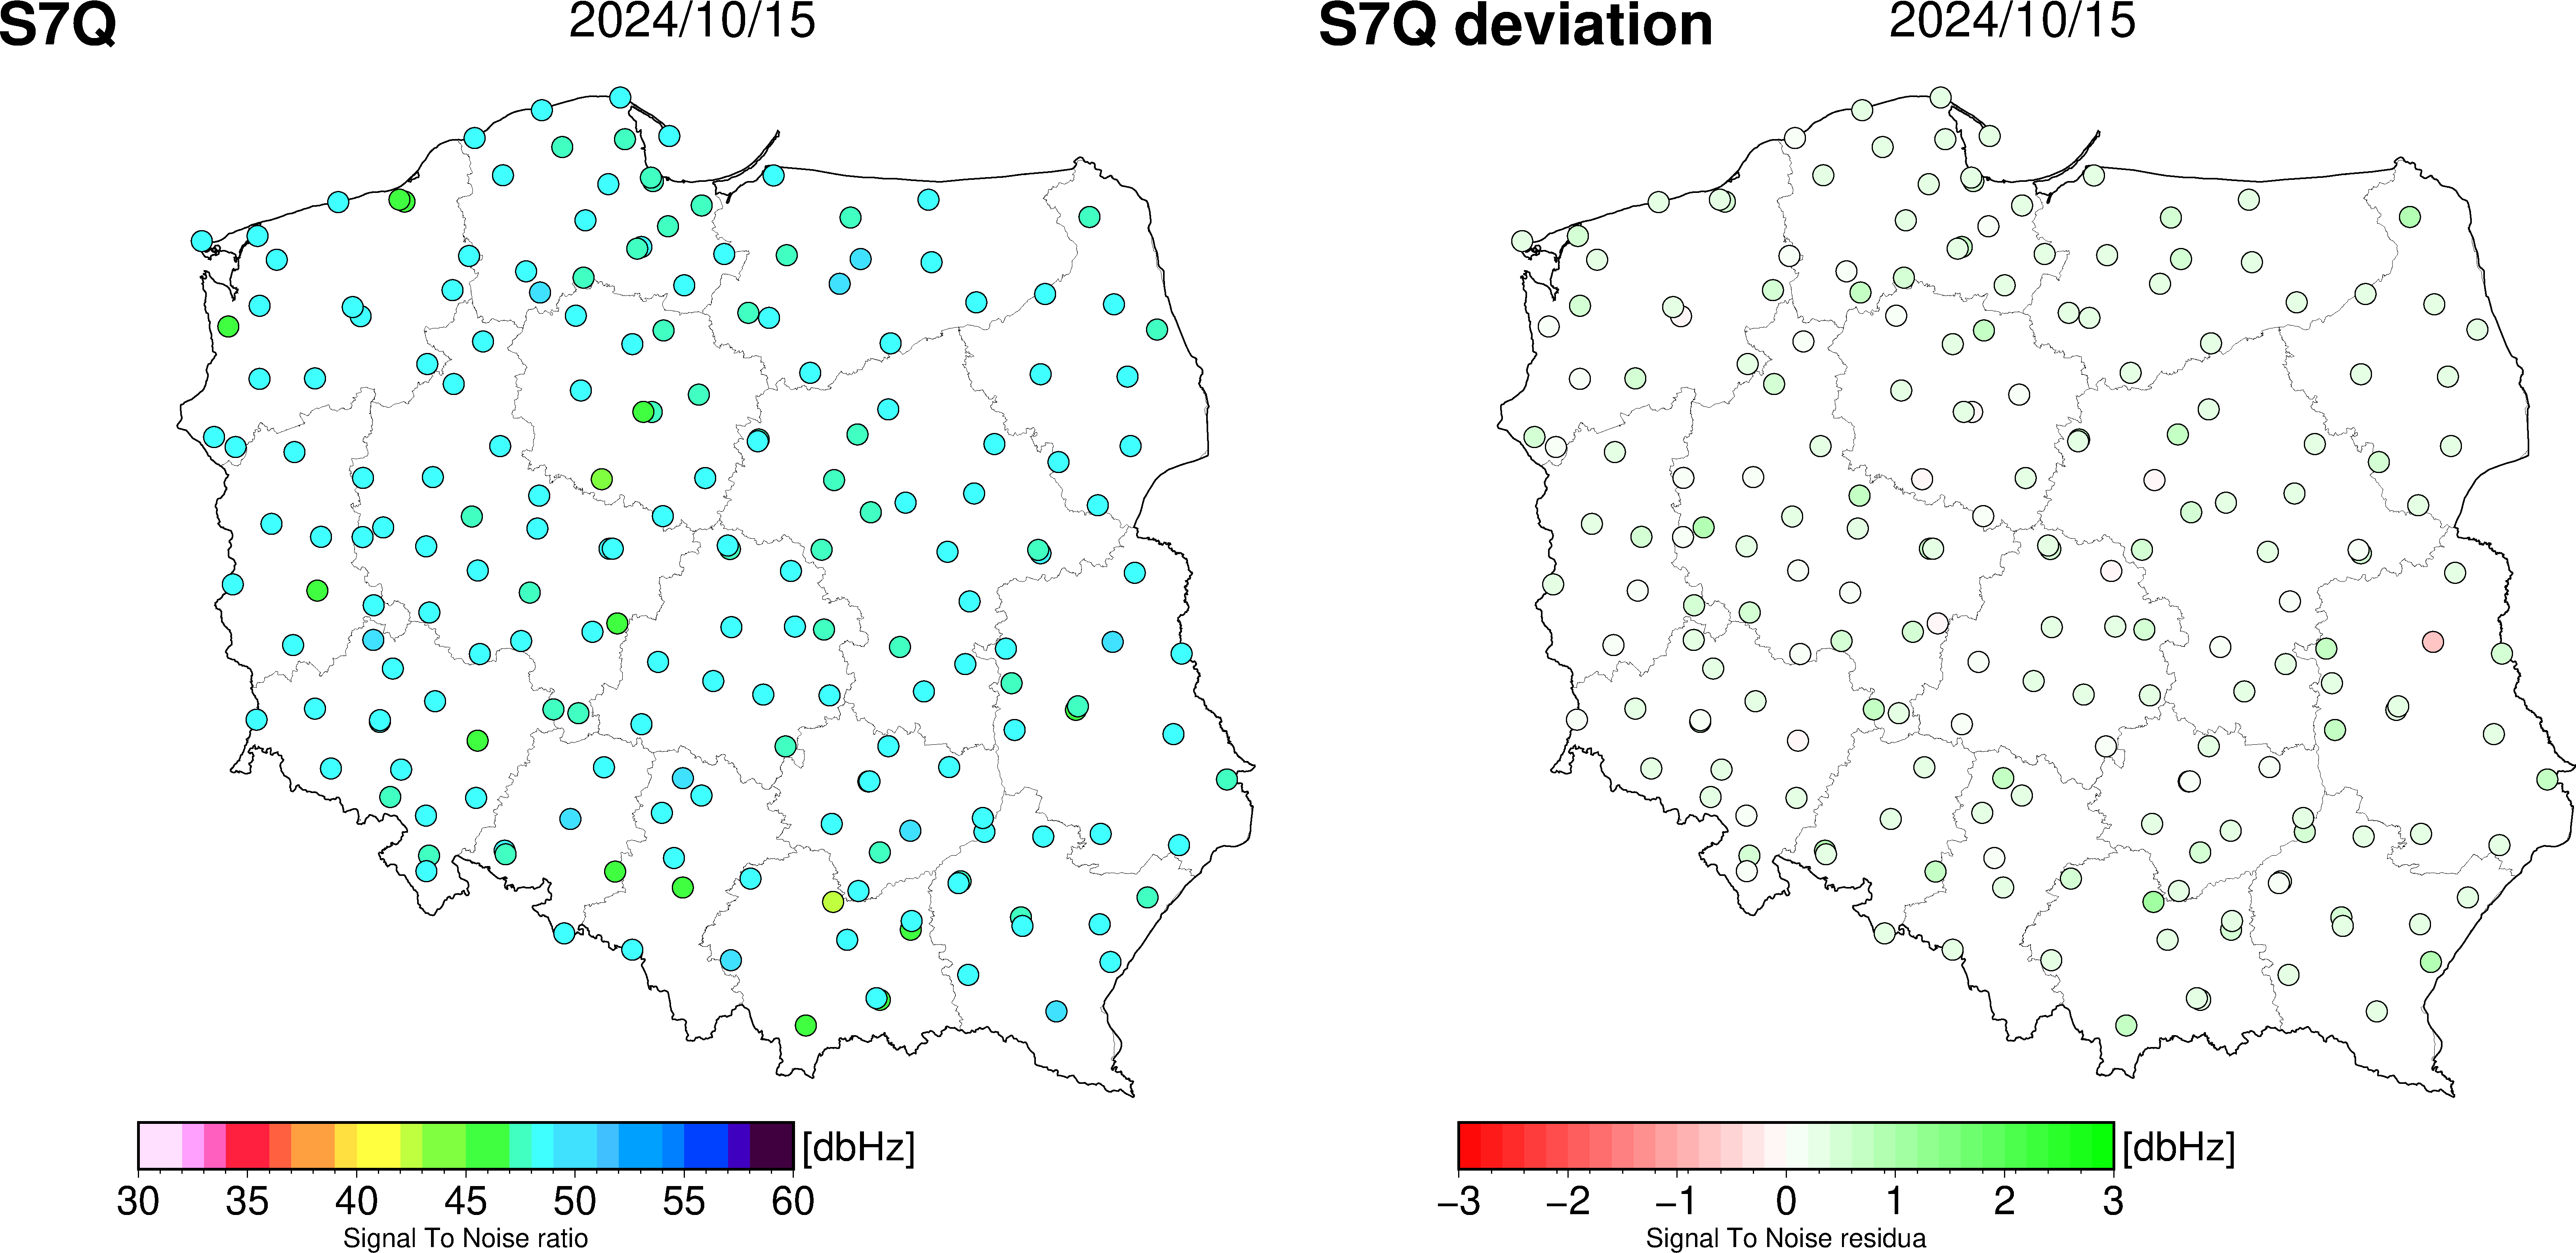
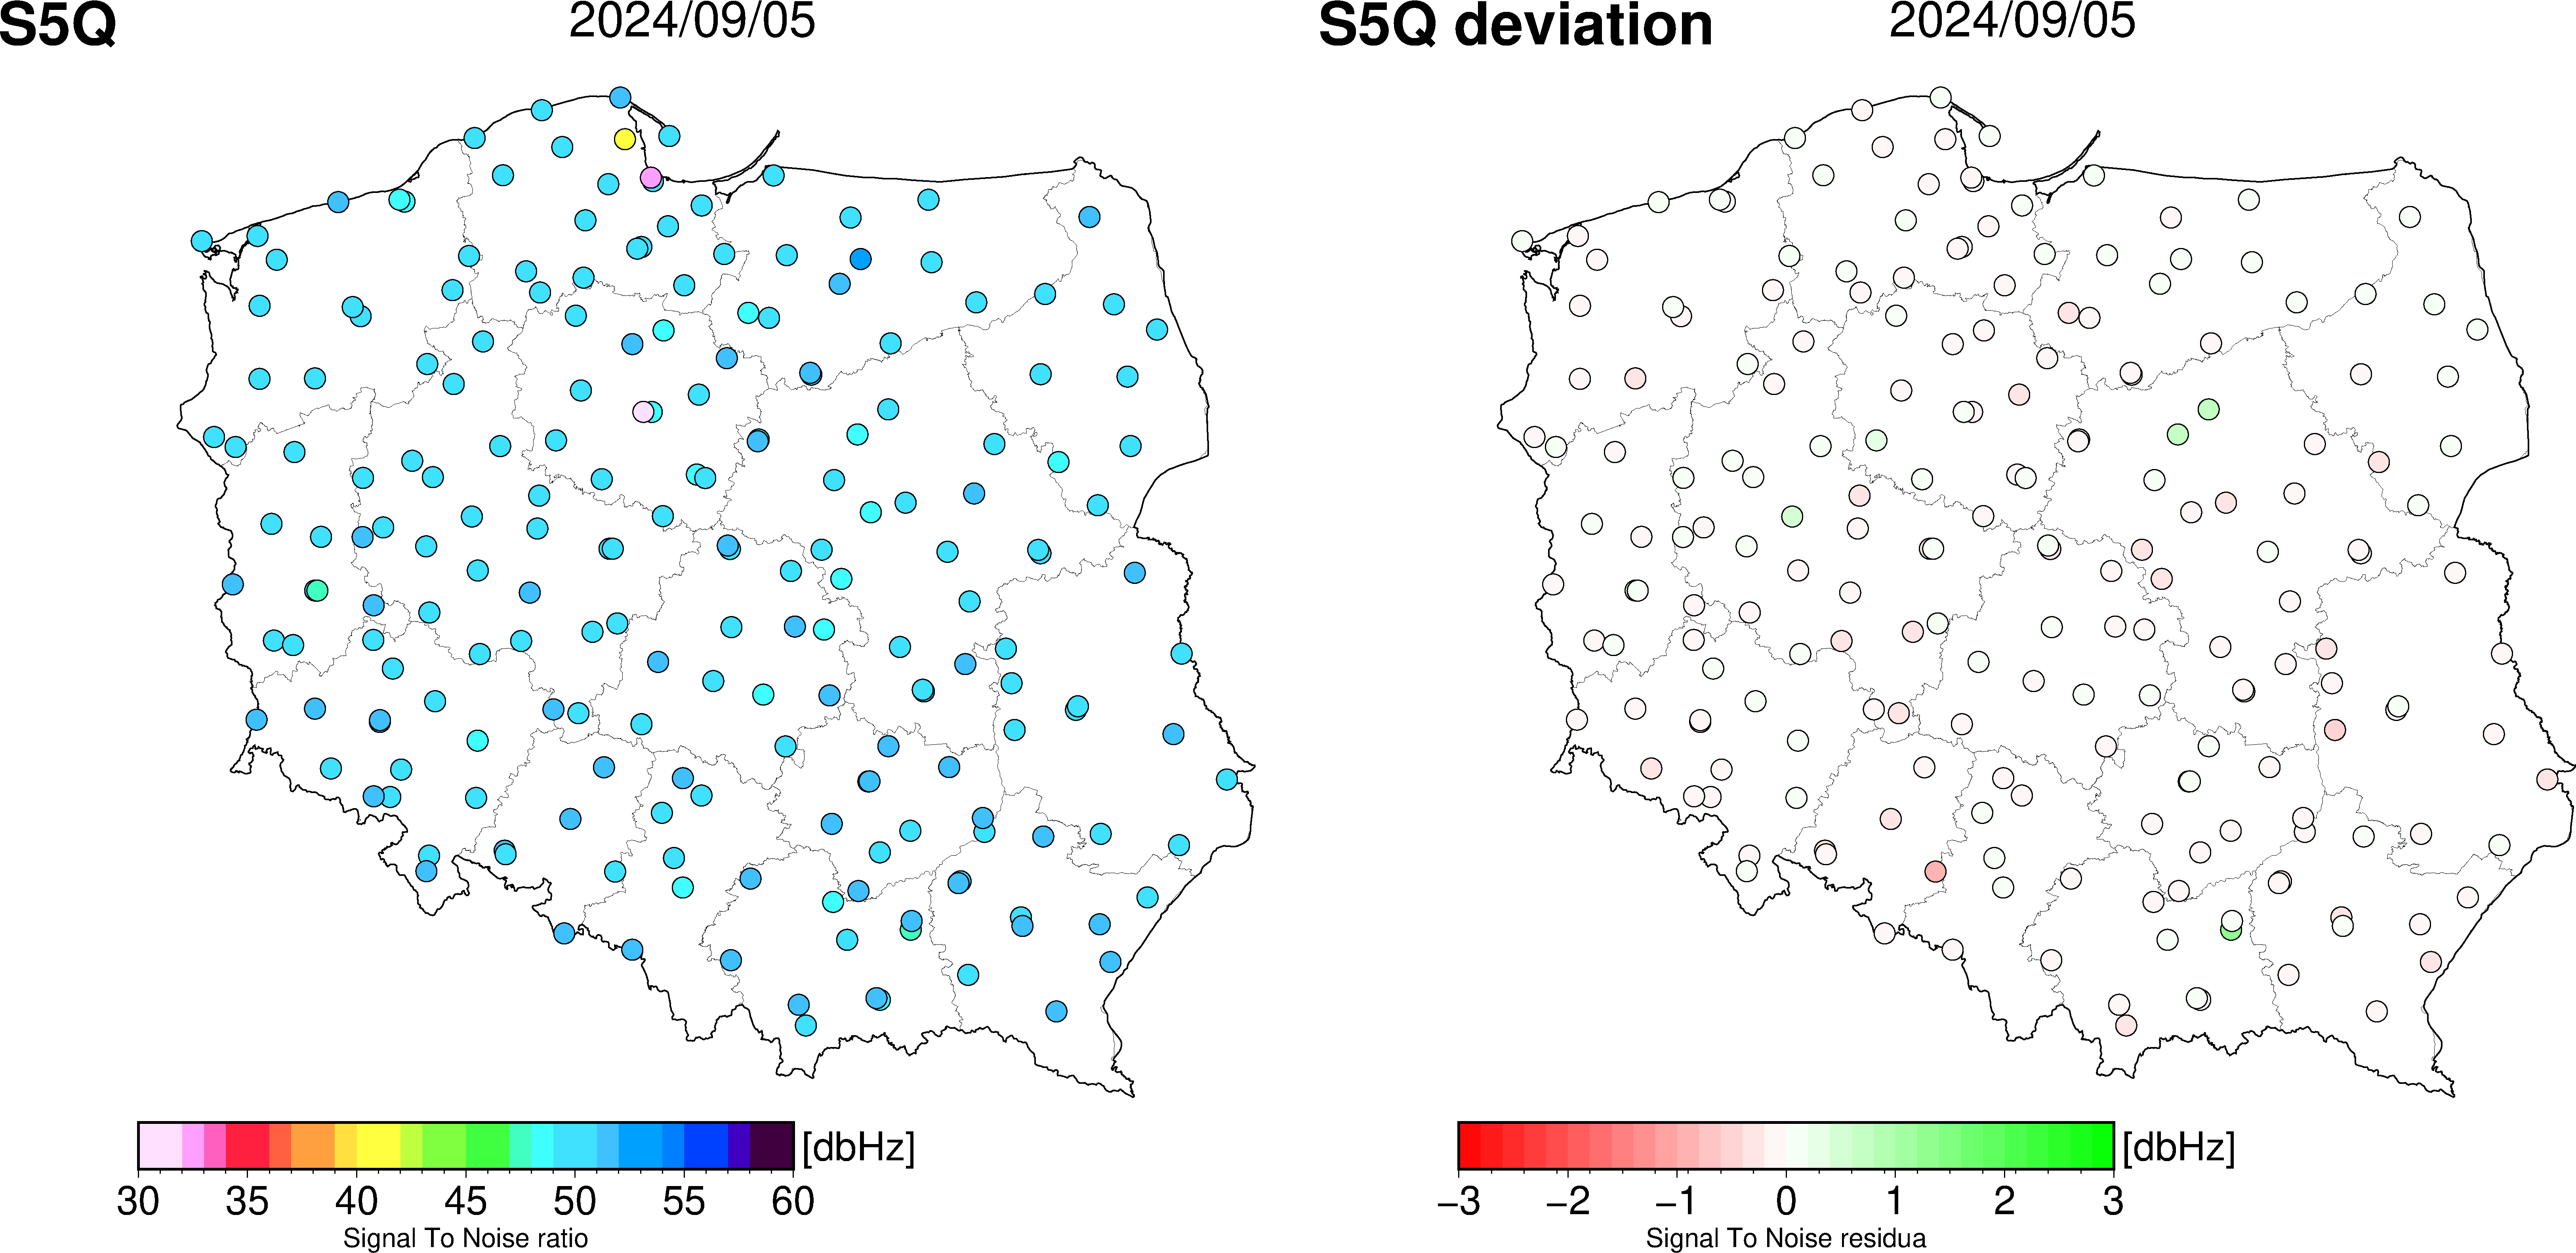
Signal-to-noise statistics for selected GNSS signals observed at stations included in CIBDG are presented below. The analysis was performed using G-Nut/Anubis software [2.2.4] based on observations in Rinex v.3. The maps show the mean values from the whole day. Click on a maps to enlarge.
GPS


GALILEO

